Tag: economy

  • US Economic Outlook (Sep 2025)

    US Economic Outlook (Sep 2025)

    Thus far, 2025 has been a year of unprecedented macroeconomic uncertainty, yet the American economy has shrugged off much of the anticipated consequences. The unemployment rate – though creeping up – remains well below historical averages at 4.3%. Inflation, a major post-pandemic headache for the Fed, has been largely tamed from its 2023 level. And in welcome news for retail and institutional investors alike, the S&P 500, NASDAQ Composite, and Dow Jones Industrial Average indices are all fresh off record highs.

    Casting a shadow over this sustained resilience, however, are alarm bells ringing ever so louder, hinting at the looming prospect that hidden underlying economic weakness would ultimately catch up with American markets.

    The Job Market

    When US inflation skyrocketed in 2023, the Fed aggressively raised interest rates to a decade-high level of 5.25 – 5.50% in an effort to cool down the economy. In doing this, its governors braced for the possibility of deteriorating the labour market, but nonetheless accepted it as necessary collateral damage to repair a more pressing issue. Yet expectations were defied: the unemployment rate only inched upwards against a record-low baseline as the country continued adding jobs, albeit at a slower rate.

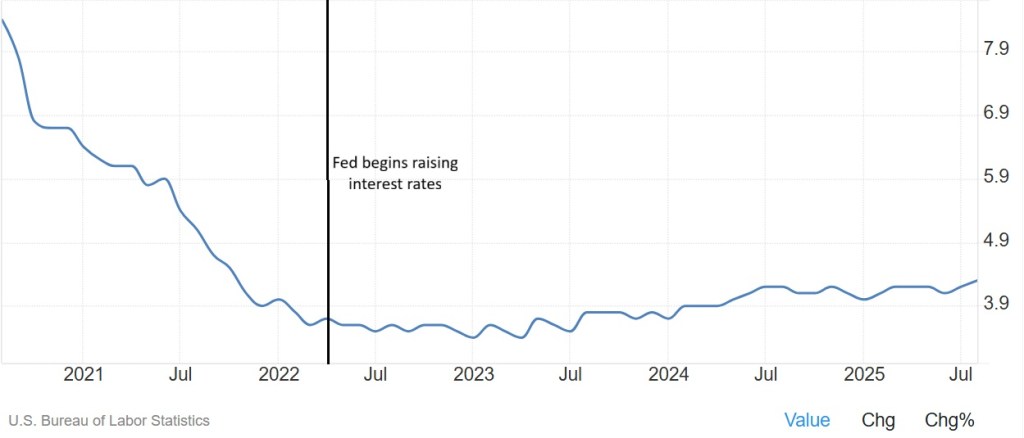
    US unemployment rate, via Trading Economics graphing tool

    In recent months, however, this resilience has been called into question. The latest revisions by the Bureau of Labour Statistics (BLS) revealed that the actual number of jobs added between March 2024 – March 2025 was 911,000 fewer than originally reported, making for the largest downwards revision since 2000. This comes a week after the weakest monthly employment report in recent memory which included yet another downwards revision, sending the net employment change into negative territory for June 2025 – the first monthly loss since the pandemic. What’s more, the total of 598,000 new jobs added through the first eight months of this year represents the lowest since the height of the financial crisis in 2009. Beyond the alarming time-stamp comparisons, it is natural for one to also fear that the Fed has been led astray in their decisions by misinformed data and that the economy was already on the back foot. Unchanged at 4.25% – 4.50% since the beginning of the year, the Fed rates remain above what most would consider to be “regular” for incentivizing optimal volumes of private investment, and the latest downpour of negative revisions casts doubts over whether it was truly appropriate to maintain this holding pattern. Though a rate cut on Sep. 18 is chanced at roughly 90% according to traders, there is a possibility that the Fed’s inaction has already allowed weakness to accumulate in the American labour market.

    Even the jobs that were truly added raises concerns. The largest contributing sector to employment growth over the past year has been healthcare & social assistance, which maintains steady hiring even during times of economic turmoil thanks to relatively inelastic demand. It is possible that strong healthcare jobs growth – which counted for nearly half of the national total over the past year – is imparting a masking effect over less favourable hiring conditions in other industries that behave more in tandem with broader economic health. For example, manufacturing – a supposed beneficiary of the Trump administration’s protectionist agenda – suffered its fourth consecutive month of job losses in August. Similarly, retail layoffs jumped 274% year-over-year in H1, while numerous other sectors ranging from business services to leisure & hospitality are beginning to post losses in recent months while simultaneously seeing previous numbers dampened by revisions.

    There is little doubt that the American labour market is finally facing a slowdown and perhaps contain more underlying weakness than initially estimated. The consolation is that it is likely not yet in a genuine contractionary phase, but rather early in a transitional period from the current “slow hiring, slow firing” stalemate before consistent job losses become reality, giving the Fed an opportunity to take timely action and avoid substantial damages. Looking longer-term, there is also hope for jobs creation through the wave of new manufacturing projects planned for the US as domestic and foreign firms alike seek to dodge tariffs and cozy up to the Trump administration, though this will take time to translate into tangible positions filled by American workers. For the near future, the job market will likely continue to soften, potentially into mild monthly contractions, but should be able to stave off catastrophic outcomes.

    Tariffs & Inflation

    America’s standing in global trade has long been a sore spot in Trump’s economic vision for the country. Indeed, it runs mammoth deficits against all of its major trading partners: Canada, Mexico, China, and the European Union. Moreover, the influx of foreign goods also stifles domestic manufacturing – which he equates to job creation and self-sufficiency. It was no surprise when the 47th President wrenched tariffs higher on virtually every partner nation, bringing the globally-averaged effective rate to a near-century record high of 17.4%, compared to last year’s 2.5%.

    It was the expectation of most economists that the tariff onslaught would cause a surge in inflation as importers pass on extra costs to consumers via price hikes. Its actual impact on headline inflation, however, has been more muted than many had forecast. The Consumer Price Index (CPI) rose 2.7% year-over-year in both June and July before ticking up to 2.9% in August, remaining within a reasonable range relative to the past year and safely below the runaway pace seen two years ago.

    The interpretation of inflation data is tricky due to the mixed forces at play. For starters, Q1 and parts of Q2 saw pronounced “frontloading” by companies who mass-imported goods with the goal of stockpiling inventory and pre-empting upcoming tariffs. This phenomenon clearly marked itself within both GDP and trade data: Q1 saw the first quarterly GDP contraction since 2022, driven by the flood of frontloaded imports which are counted against net GDP in calculations while monthly trade deficits reached record levels between January and March. Such stockpiling likely delayed the full onset of tariff-driven inflation impacts as companies were able to stretch their ability to maintain regular pricing. Looking forward, though, it would be unrealistic to assume this cushioning effect will persist. A flurry of sellers, ranging from Walmart and Target to Home Depot and Adidas, recently announced price increases citing tariff pressures. The latest headline inflation rate of 2.9% – though not yet at frightening levels – represents the highest since January. As frontloaded inventory dwindles and companies are forced towards higher costs, it would be no surprise to see CPI year-over-year growth return above 3% sooner than later. A more important question for many, though, regards where this uptick will eventually halt. Will companies fully reach their new cost-pricing equilibrium by year-end, or perhaps by mid-2026? Will CPI growth reach 3.5% year-over-year by then, or 4.5%?

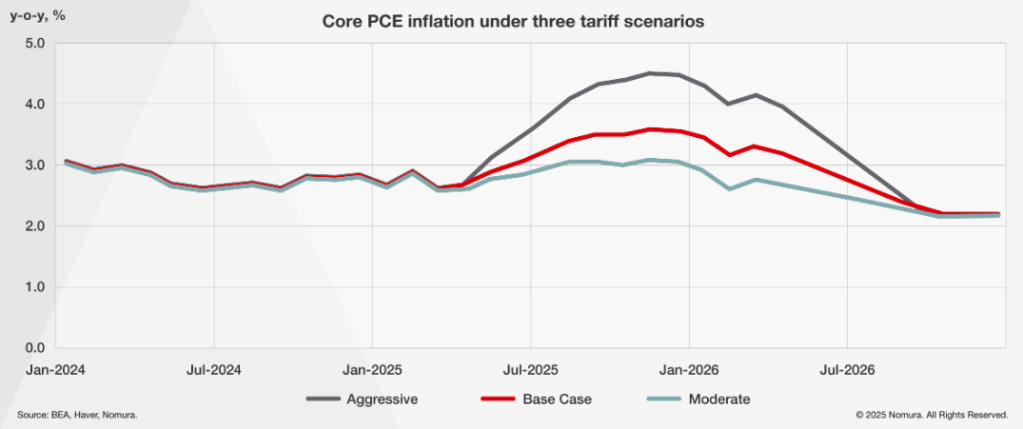
    via Nomura: Forecasting the Tariff Impact on Inflation

    Of course, there are a host of other factors to consider beyond simple import duties. Nomura’s projection (pictured above) considers only core inflation with energy and food items stripped. Depressed crude oil prices have translated into cheaper energy for Americans over the last year, counterbalancing other price increases in calculating the headline rate. There is also uncertainty on the extent of costs that will be passed on to consumers: so far, estimates suggest that this figure is only 22% of total costs, with nearly two-thirds being absorbed by companies themselves. The Republicans’ “One Big Beautiful Tax Bill” includes numerous provisions allocating firms billions in potential savings which could be used to offset tariff costs, whether fully or partially. Furthermore, underlying demand may not be sufficient to support significant price hikes for many sellers – consumer staples producer Proctor & Gamble warned in its latest earnings call that American shoppers are exhibiting signs of constraint and slowing down purchase frequency. Should this pattern reflect on a broader scale, firms’ abilities to pass costs on to consumers will face limitations.

    On the inflation battleground that has rocked the country for the past two years, it is reasonable to project further accelerations into 2026 as importers deplete existing inventories and adjust to new costs, settling the headline CPI growth above 3%. However, the ability of companies to absorb costs themselves should not be discounted, particularly at a time when the demand outlook is unclear given red flags in other corners of the economy.

    What’s the Priority?

    The two topics discussed so far – the labour market and inflation – puts Jerome Powell’s Fed in a delicate balancing act. At a time when both are showing danger signs, its Board of Governors must choose a priority. At this current point in time, the latter will likely take the spotlight. Though a 3.0+% CPI growth rate is far from ideal, it does not pose the same runaway risks as seen in the post-pandemic episode. The 2021 – 2023 fiasco was fuelled by severe supply chain disruptions and an explosion of pent-up consumer demand, all exacerbated by the Fed’s initial decision to maintain near-zero rates in the mistaken belief that price spikes would quickly self-regulate. The driving factors behind the current onset of tariff-induced inflation are far weaker. Whereas entire supply chains were upended by factory shutdowns, logistical bottlenecks, and lean inventories in 2021, the impact of tariffs today do not require extreme restructuring of supply chains with cost-passing and absorbing options available to most sellers. The most probable outcome is a more moderate one-off pricing adjustment rather than the sustained inflation blowup previously seen, especially in the face of significantly more controlled consumer demand and an environment where Fed rates are already at elevated levels.

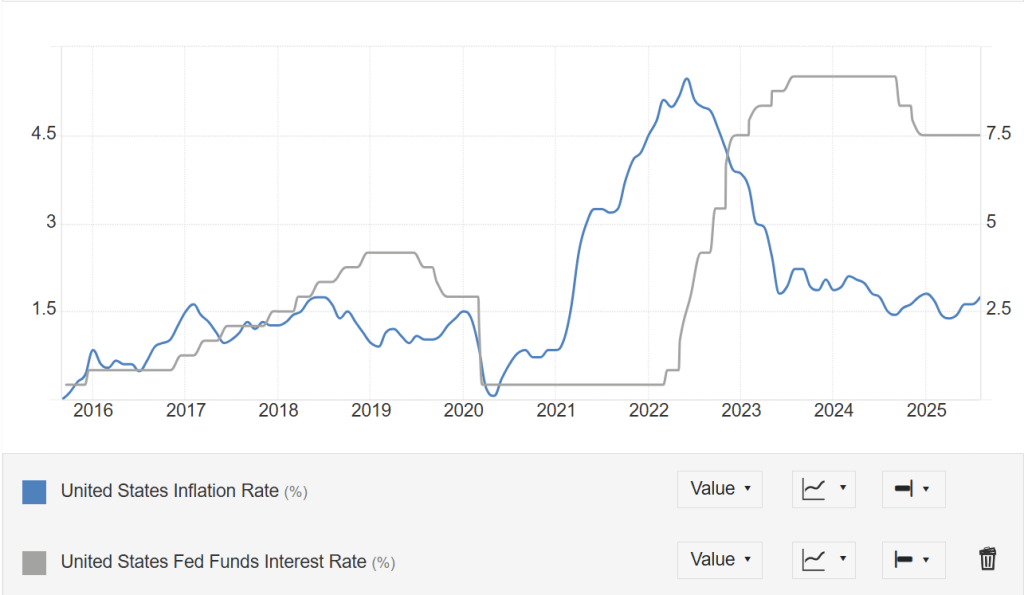
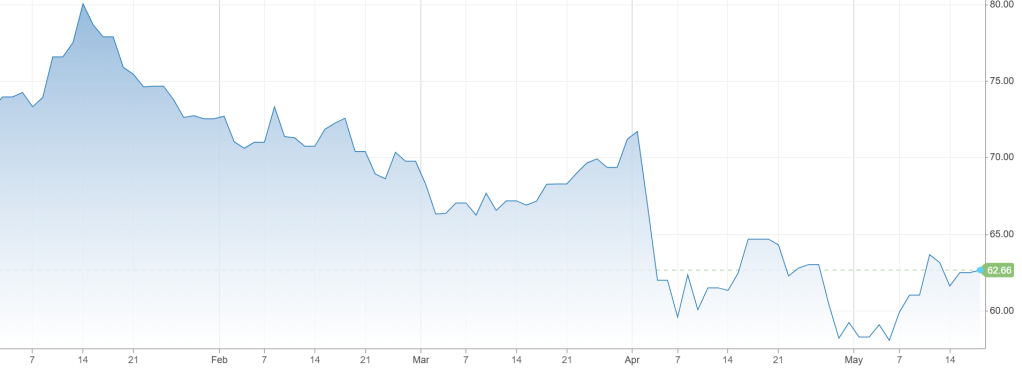
    US Inflation vs Fed Rate, via Trading Economics graphing tool

    By contrast, labour market weakness pose a real risk of quickly evolving into a rampant collapse. While rises in the unemployment rate has been small thus far, they have a historical tendency to aggressively surge at the onset of recessions – during the 2007 – 2009 crisis it rose from 4.7% to 10% within two years. In other words, when the signs of flaring deterioration appear, it is likely already too late. As such, even seemingly temperate softening of the labour market warrants close monitoring and – in today’s case of existing 4.25% – 4.50% interest rates – potential pre-emptive action. Given the American job market’s recent slumping signs as well as newly-unveiled underlying weakness, the Fed should strongly consider cutting interest rates at a hastened pace to safeguard against future rapid deterioration, especially considering that tariff-related inflation risks are likely to be bounded in nature, unlike its post-pandemic counterpart. Rate cuts may also produce indirect stimulus to a stagnant American housing market, which is facing sunken transaction volumes as purchasing power is stifled by restrictively high mortgage rates. Though the 30-year fixed mortgage rate typically tracks the 10-year Treasury Note, a series of Fed rate cuts will translate indirectly into borrowing cost relief for American homebuyers.

    The Equities Market

    If there is one corner of the American economy that has demonstrated remarkable resilience, it is its equities market. All three major stock indices broke intraday and closing records on Sep 11 & 12, continuing a historical bull run spanning the past two years. For the most part, this is justified by strong earnings: 77% of S&P 500 companies beat their EPS estimates in Q2 with the aggregated average surprise margin standing at +7%, well above the 2011 – 2019 average of +3.3%.

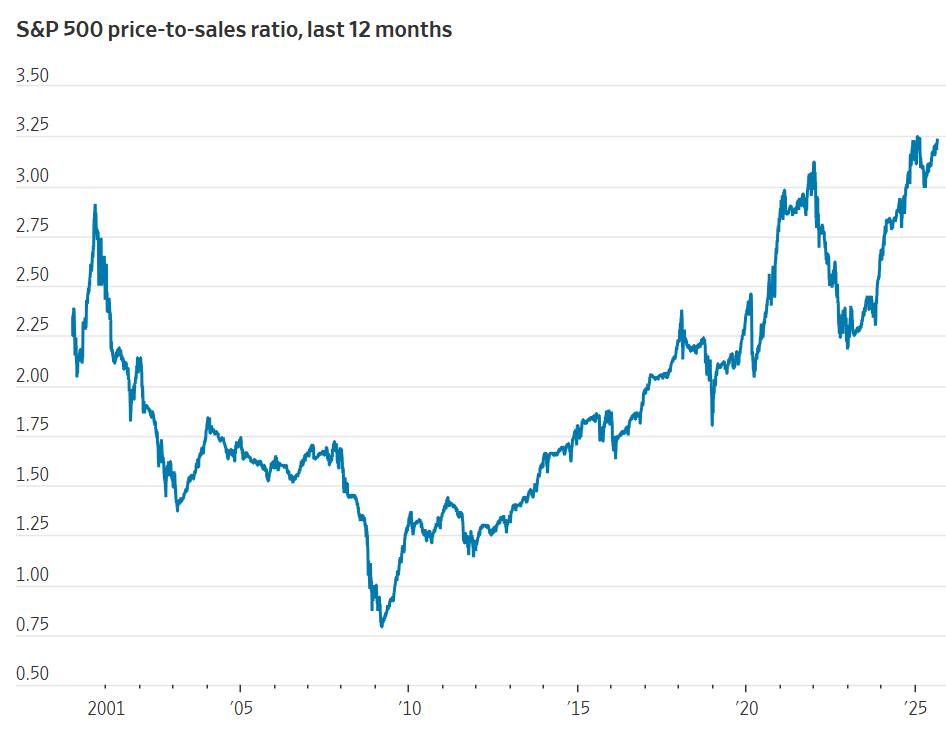
    The cautionary watchouts in the stockmarket are tales of imbalances. Strong bottom-line growth have brought delight to investors, but they rob visibility from disproportionately slower revenue growth. While blended EPS results pointed to 11.7% year-over-year net income growth, revenue growth was far more modest at 4.9%, calling into question whether headline earnings should be attributed to cost-cutting and margin-widening activities more so than genuine demand growth. Indeed, while strong earnings have kept the index’s P/E ratio relatively steady, the same cannot be said for its P/R ratio – which has hit heights unseen since the Dotcom bubble in the early 2000s. Should cost reduction capacities dry up, current indications suggest insufficient underlying revenue growth to support these historical prices.

    via FactSet

    Another imbalance exists in the distribution of industries within the market’s top performers. Nearly three-quarters of the S&P 500’s Q2 earnings growth can be credited to two industries: information technologies (IT) and communication services, which have enjoyed significant propulsion from the artificial-intelligence push of recent years. However, this uneven distribution raises concerns over the true performance of the broader market. Furthermore, despite taking the lion’s share of bottom-line growth, it still may not be enough to fully justify the lopsided standing of IT companies in the American equities market. Over the last three years, their share of the S&P 500 has expanded from 22% to 32% – far outpacing their share of net income, which only grew from 21% to 23%. This unusually top-heavy and tech-concentrated layout raises concerns over excessive dependency on a technological sector that still bears many uncertainties.

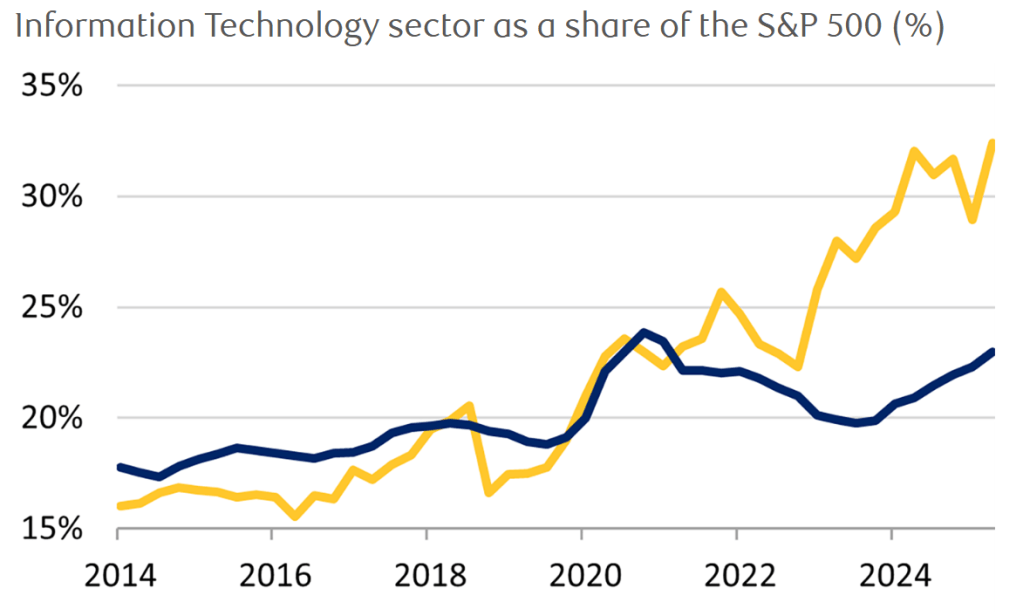
    via RBC (yellow: % of market cap; blue: % of net income)

    Though this bull market has been supported by strong earnings, there are hints that it lacks foundational revenue growth and may be leaning too heavily on operational margin-widening efforts, which cannot be expected to remain sustainable over the long term. Additionally, the unusual concentration of tech companies within the market’s apparent performance may be masking the reality for other industries, running the risk of amplifying pullback reactions should the AI movement suffer a considerable setback in the future. All in all, the historical territories in which the American stockmarket finds itself today lacks the supporting pillars for sustainable continuity, and a correction can be expected in the near future – whether triggered by weak economic data, earnings underperformance, or some other development.

    The Verdict

    While the American economy has demonstrated considerable resilience, it is likely to soften in the coming months:

    • The labour market may slip into narrow monthly contractions, but should be able to avoid significant losses and bounce back before year-end as the Fed cuts rates.
    • Headline year-over-year inflation will likely return above 3% but shouldn’t grow uncontrolled as it did in 2021 – 2023, likely settling under the 4% pace.
    • The stockmarket will suffer a pullback, possibly triggered by weaker-than-expected Q3 / Q4 earnings or pessimistic economic data.
  • Clean Hydrogen: Market Analysis & Outlook

    Clean Hydrogen: Market Analysis & Outlook

    Between 2020 – 2022, a market frenzy was sparked for clean hydrogen production as part of an overall green push that gave rise to billions of dollars worth of announced projects in tandem with the rollout of government incentives. Three years on, the enthusiasm has dwindled – and rightfully so, given the myriad of underlying infeasibilities that were masked by the initial craze.

    Hydrogen Fundamentals

    Hydrogen – from a consumption point of view – is a clean fuel because it produces zero carbon emissions when undergoing combustion or deployed in a fuel cell. However, its true carbon-neutrality depends on the method of production, which follows a colour-coded system. The most common origin of commercially produced hydrogen in the United States, by far, is steam-methane reforming (SMR). As its name suggests, the process reacts steam with methane – a common product in petroleum refineries – to produce hydrogen and carbon dioxide. This avenue of production is termed “grey” hydrogen and does not fall under the umbrella of “clean” hydrogen because of its carbon dioxide byproduct. Discussions of clean hydrogen usually refer to the “blue” and “green” variants. The former is produced via SMR just like its grey sibling, except the carbon dioxide byproduct is captured and sequestered in the process. The latter uses an entirely different mechanism called electrolysis in which water is split into its two constituent elements: oxygen and hydrogen. To conduct electrolysis, electricity must be supplied as an energy input, effectively generalizing green hydrogen production as a power-to-gas process using renewables such as solar and wind. Of the total North American hydrogen capacity online today, 96.1% is the grey type, while blue and green makes up 2.7% and 0.1% respectively.

    via “North American Hydrogen Production Report – January 2025” (respectmyplanet.org)

    The Current Hydrogen Market

    The hydrogen boom at the start of the decade triggered no shortage of chatter about boosting clean production, and yet there was little consideration for whether underlying demand existed for these planned production increases. While the marketing initiatives for these projects pushed a grand vision for hydrogen to be deployed in green applications such as zero-emission transportation, power generation, and heating, the reality of its usage is starkly different. Today, practically all hydrogen consumption in North America are for industrial uses – and virtually none for transportation or power generation. Perhaps ironically, the most prominent current application of hydrogen is for oil refining, where it is used in desulfurization and hydrocracking (converting heavier hydrocarbons into lighter, more valuable ones like gasoline and diesel). Another major point of consumption is for ammonia production, critical for fertilizer and various industrial chemical products. These two main usages, alongside numerous other chemical production processes, are the true drivers of hydrogen demand – not the imaginative green technologies heralded by environmentalist policy-pushers.

    The industry-heavy nature of existing hydrogen demand introduces another niche industry characteristic: the supply doesn’t necessarily come from dedicated hydrogen merchants – in fact, merchant hydrogen accounts for just half of total US production. Most ammonia facilities make grey hydrogen on-site, while some oil refineries are fitted with their own SMR units. The result is a sizeable allocation of total hydrogen capacity to these in-house producers.

    Hydrogen Production Source% of US Production
    Oil refineries20 – 25%
    Ammonia plants15%
    Other chemical & industrial facilities15 – 20%
    Merchant hydrogen40 – 50%

    The market for dedicated merchant gas is dominated by three major companies: Air Products, Linde, and Air Liquide.

    In essence, there is nothing clean about North America’s current hydrogen usage or production. Attempts to force the industry into an environmental mold are not only misinformed, but destined to fail financially.

    The Cost Gap

    The rush of clean hydrogen endeavours during the boom was a case of gross demand overestimation. The most glaring attribute sealing its underwhelming fate is a simple one: cost.

    Hydrogen TypeCost ($/kg)
    Grey$1.00 – $2.93
    Blue$1.30 – $4.70
    Green$3.00 – $7.00

    Grey hydrogen – particularly for users with in-house SMR units – is simply so cost-efficient that it largely curbs any economic argument for pivoting to cleaner variants in the absence of government incentives. For select facilities already making grey hydrogen, blue production is somewhat plausible because the two mechanisms largely overlap bar the addition of a carbon-capture unit for the latter. The green kind, however, sticks out like a sore thumb. It is bogged down by expensive renewable power costs which is all the more apparent in the US than, say, China where solar and wind capacities are far more abundant. Furthermore, commercial electrolyzers – which typically operate around 70% efficiency – have high manufacturing, setup, and support costs. Another key consideration is the production location relative to its intended user. Hydrogen – first on periodic table of elements – packs incredibly low density which makes transportation significantly more difficult in comparison to other industrial gases. This poses a challenge for electrolysis facilities situated away from their would-be industrial customers, who must deal with additional costs – and energy losses – if they choose to switch from on-site grey / blue hydrogen to merchant green hydrogen. Due to these technical challenges, polarizing costs, and the maturity of existing SMR production dominating the market today, green hydrogen is unlikely to emerge as a commercially feasible option.

    At a glance, blue and grey hydrogen’s cost differential seems far more acceptable, but the $0.30 – $1.77 gap would be wider if not for US government incentives – most notably the Inflation Reduction Act (IRA)’s $3/kg tax credit for clean production. Moreover, carbon captured and sequestered from SMR are eligible for up to $85/ton tax credits, though this is non-stackable with the aforementioned hydrogen benefits but nonetheless offers producers flexibility. At its core, blue and green production differ in that the former is a modification to matured technology while the latter is a completely new pathway. This raises questions regarding the long-run underlying appeal behind blue hydrogen: no matter how efficient the process becomes, it will simply never be cheaper than grey production. In other words, investments into blue hydrogen are driven purely by government environmental incentives, not in hopes of technological or efficiency improvements. However unlikely the prospect is, one can make the argument that there may be a future where electrolysis can produce gas that is both cheaper and cleaner, but this is an impossibility for its blue counterpart because it is merely an extension of SMR and can therefore never beat its “baseline” cost-efficiency. It would not be unreasonable, then, to term the blue hydrogen market dynamics as fully policy-driven.

    Where’s the Demand?

    Clean or not clean, the influx of planned hydrogen production needs matching demand growth to be justifiable. Unsurprisingly, projected supply far outpaces actual demand. As of last year, it was estimated that developmental projects in the US would bring 13.9m tons of extra annual production online by 2030. This paints a stark disparity when compared to the 10-11m tons that the country currently consumes per year. This gross demand overestimation failed in assuming imminent growth in hydrogen-based transportation and aviation, which were long shots at best. Although fuel-cell electric vehicles (FCEVs) are commercially available, its total count in the US stands at just 18,700 (less than 0.01% of the broader auto market) for passenger and commercial automotives combined, nearly all of which are located in California thanks to its status as the only state with usable refueling infrastructure. As of late, its growth outlook has been further hamstrung by the rise of standard battery electric vehicles, which boasts more than doubled energy efficiency. Hydrogen’s adoption in aviation remains largely in the space of small-craft regional test flights, and the broader effort suffered reality checks when Airbus – the main established player to show belief in the fuel – delayed its timelines and admitted commercial-sized applications won’t be viable within the next 20 years.

    With these disruptive green innovations wiped out of the picture, the role of demand drivers falls back upon the unglamorous industrial companies who have long acted as the underappreciated backbone of the hydrogen market. Yet even they cannot accommodate the planned surge in supply. Barring a revolutionary technological shift in the oil & gas, fertilizer, or chemical industries, the gap between industrial hydrogen usage and future production is insurmountable.

    Early Cracks

    The reality of clean hydrogen production is already setting in for some investors. Air Products, one of the “big three” in the American merchant hydrogen market, began the year by axing multiple projects including a $500m green plant in New York as it fully exited the American green market as a whole. Last month, it paused construction for its blue facility in Louisiana while it attempts to sell off parts of the over-budget project.

    The downwards spiral for green hydrogen is reflected in the broader market with only 7% of projects on schedule as of 2023 and the vast majority either paused or cancelled altogether. Blue initiatives have fared far better with minimal high-profile cancellations thus far, but their future is far from guaranteed. For starters, the Republican Party’s “One Big Beautiful Bill” seeks to eliminate the 45V clean hydrogen tax credit starting in 2026, putting a deep dent into the financial payoff for production efforts. Though this development is partially cushioned by the presence of 45Q carbon capture credits – which are due to remain in place even if the Republican tax-and-spending bill is passed – it nonetheless deals a blow to returns on the investments and operation of carbon capture in tandem with SMR units. In the context of blue hydrogen production, the $85/ton credit for captured & sequestered carbon is roughly equivalent to $0.80/kg of hydrogen produced when considering typical capture rates, which falls well below the potential $3.00/kg offered by 45V credits. This calls for careful consideration of economic viability in a scenario where hydrogen incentives are eliminated – a looming prospect in the current political climate.

    Beneath the mathematics of incentive-driven returns, the foundation of demand is weak. Only 2% of new production planned for 2030 have binding offtake, while 6% have non-binding offtake and 92% have none at all. Even for projects that have reached final investment decisions, over 45% remain uncontracted. Combine this already-wobbly demand with potential slashes in government incentives and the outlook for clean hydrogen appears all the more muted. Adding to the uncertainty is global trade tensions which threaten to cast even more shadows over demand in the form of costlier foreign-made electrolyzers and reduced overseas demand for clean gas exports.

    The Verdict

    The euphoria around clean hydrogen production in the early 2020s ignored weak underlying demand and assumed explosive growth in sectors that lag well behind commercial viability. Fueling this misplaced enthusiasm was supply-side government incentives that encouraged irresponsible production boosts without stimulating reflective demand. The result is a market that is now plagued by uncontracted supply and the increasingly threatening prospect of diminished government benefits.

    At its current pace, it is reasonable to forecast further collapses in planned clean hydrogen projects – even the blue type. Should the unravelling of environmental policy continue, the market will return to leaning on its established grey production base. For green hydrogen, it is a case of when – not if – investments will be abandoned. For blue hydrogen, its identity as an environmental-oriented modification of its grey sibling means that its future lies almost entirely on government policy.

    The bottom line: near-term hydrogen demand is almost entirely industrial and is thus best accommodated using mature grey production infrastructure. The introduction of clean supply is unnecessary and grossly exaggerated, making it destined for failure in the absence of heavy government support.

  • Crude Oil Price Analysis (May 2025)

    Crude Oil Price Analysis (May 2025)

    As the global economy approaches this year’s halfway mark, there has been no shortage of turbulence for nearly every market. Crude oil futures – encompassed by Brent and West Texas Intermediate (WTI) – is no exception. On the first day of the year, WTI front-month futures closed at $73.96/bbl. Today, it sits at its lowest level since 2021 at under $63/bbl, hammered by the gloomy outlook of international trade and fears of an imminent supply surplus.

    WTI Front-Month Price (via CNBC)

    Death by Tariffs

    US President Donald Trump’s tariffs had a marked impact on crude prices as it threatened a global slowdown in economic expansion, casting doubts over oil demand amid the prospect of reductions in shipping, construction, and manufacturing activity from stymied trade.

    Trade News & WTI Futures Impact

    DateWTI Front-Month Closing PriceTrade News
    Feb 4$71.03 (-2.38%)The US implements new 10% tariffs on all Chinese imports.
    Feb 13$70.74 (-1.09%)Trump announces plans for reciprocal tariffs.
    March 4$66.31 (-2.60%)The US implements 25% tariffs on Canadian and Mexican imports, with 10% on Canadian energy. Tariffs against Chinese goods are raised to 20%.
    April 2$66.95 (-4.87%)Trump announces “Liberation Day” reciprocal tariffs on dozens of countries, including a baseline 10% tariff on all countries.
    April 5$59.58 (-2.38%)The US implements its baseline 10% tariff.
    May 12$63.67 (+4.34%)The US agrees to suspend tariffs on Chinese imports from 145% to 30%, while China cuts their retaliatory rate to 10%.

    The slide in oil prices began due to widespread expectations over President Trump’s protectionist trade agenda even before it was officially rolled out. Despite starting the year bullishly to reach a high of $80.04/bbl thanks to concerns over supply shortages induced by sanctions on Russian energy exports, these gains were largely erased by the time of the US inauguration. Throughout February, prices were dampened by concerns over global macroeconomic conditions but remained relatively stable with front-month futures hovering around the $70/bbl mark. Although further tariffs were announced, there was still persistent expectations that deals could be reached before their official implementation – especially as a 30-day pause was given to Canada and Mexico just days after the American president signed the executive order greenlighting new duties on its neighbours. This period can be best described as a “passive cool-off” where prices were moderately suppressed in adjustment to the newfound trade uncertainty as well as slight supply increases.

    Hopes of de-escalation within North America vanished when the 30-day pause expired in early March with no new deal reached with either Canada or Mexico. The official imposition of American tariffs on its closest trading partners dealt the largest-yet trade-related blow to crude prices, sinking the WTI to a 6-month low of $66.31/bbl. It was evident by this point that demand-side momentum had turned downwards as the world’s largest economy had now levied barriers against all three of its biggest trading partners. Although oil prices staged a modest month-long comeback, aided by talks of heightened sanctions on Russian and Iranian energy, market sentiment was firmly trapped in bearish territory. Ultimately, this recovery would be decimated as Trump laid out his “Liberation Day” tariff plans, wiping out 13.55% from front-month prices in 48 hours to a near 4-year low. In the weeks that followed, WTI futures tanked below the $60/bbl mark for the first time since the COVID era – breaching the average breakeven price of $62/bbl for most American producers.

    Futures eventually returned north of $60/bbl following the US-China agreement to drastically scale back tariffs for 90 days in an attempt to hash out a new deal, but the difference is night and day when compared to the beginning of the year.

    Supply-Side Worries

    There is little doubt that trade deteriorations were responsible for the bulk of market turmoil, but downward pressures do not exist solely on the demand side. Since the start of the year, oversupply has become an increasingly more pressing threat for global crude prices. Most prominent is the Organization of the Petroleum Exporting Countries (OPEC)’s decision to boost production at an accelerated rate of 411,000 BPD in May and June, whose announcement sent crude prices further down amid the tariff slide. This effectively puts the coalition 4 months ahead of schedule relative to its original plan for undoing its voluntary cuts.

    Geopolitical tensions has played a balancing role on the supply side over the past year, with sanctions on countries such as Russia, Iran, and Venezuela choking supply from would-be major producers. However, these supply constraints show signs of loosening. The US is actively in talks with Iran over a new nuclear deal which, if achieved, is likely to permit the Middle Eastern producer to export more crude. The 2015 Iran JCOPA deal gave way to 1m BPD of extra production, establishing a sizeable reference if a similar deal is to be struck. Moreover, much of the short-term flareups in the Middle East that pushed temporary supply disruption fears last year – including direct strikes between Israel and Iran – have disappeared. All the while, the diplomatic push to end the Russia-Ukraine war have accelerated this month, though it is unclear the extent of loosening any ceasefire or peace agreement will bring to existing sanctions.

    What’s Next?

    Of demand and supply side outlooks, the latter is far more predictable. Put simply, there is only one foreseeable direction for global crude supply: up. The International Energy Agency (IEA) estimates full-year supply growth of 1.6m BPD and 970k BPD for 2025 and 2026 respectively in its latest report, an upwards adjustment from 1.2m BPD and 960k BPD previously. Much of this rise comes from non-OPEC producers in the Americas. Though some American producers have signaled their intentions to cut spending amidst lower crude prices, this shouldn’t incur cuts in overall production thanks to improved extraction efficiencies and lowered operating costs after years of establishing infrastructure maturity – ConocoPhillips and Occidental Petroleum both announced plans to spend less this year but will maintain current production targets. Overall, US production is set to expand by 600k BPD this year and 500k BPD in 2026, with the majority coming from the Permian Basin. Canadian output – already the 4th largest in the world – is forecast to grow by 300k BPD this year and 200k BPD in the next, supported by an expansion of the Trans Mountain Pipeline that came online operationally this month which effectively triples the liquids transportation capacity from Alberta production sites to Burnaby, British Columbia for export. Several offshore projects are also due to begin production in Guyana and Brazil, expected to contribute an additional combined 300k BPD in each of the next two years.

    Annual Americas petroleum & other liquids production (via EIA)

    Beyond these baseline production boosts, one cannot rule out the possibility of further variable supply injections if geopolitical relations ease. The most probable scenario is the revival of an Iranian nuclear deal that sees some sanctions lifted – an ongoing negotiation which has already shaved off oil prices after news of positive developments. Last week, Trump announced the removal of all sanctions against Syria, opening the door for a resurgence in Syrian exports which, at its peak, amounted to 148k BPD. Though nowhere near the world’s biggest producers, the country benefits from a strategic geographical location in the Eastern Mediterranean with access to European markets.

    It is much harder to pinpoint the exact direction of crude demand. While US tariffs have de-escalated over the last month, they remain substantially higher than before Trump took office. In its January report, the IEA forecasted full-year demand growth at 1.05m BPD. Since then, that number has been trimmed to 740k BPD, reflecting the anticipated slowdown in economic activity as a result of trade barriers. While it is unclear what the final form of US trade policy will look like, the Trump administration has thus far suggested the 10% universal tariff will remain in place regardless of progression on new trade deals, making it more likely that a new norm will be set for global economic flow rather than a reversal to freer terms of trade.

    In general, it is non-OECD countries like China and India that are expected to lead global oil demand growth, which the IEA estimates at 860k BPD for this year, in contrast with a decline of -120k BPD from OECD members. China, the world’s second largest oil consumer, has shown weaker-than-expected delivery data as it struggles to boost internal economic demand. While it has been introducing a consistent stream of fiscal packages aimed at stimulating domestic activity, its manufacturing industry is feeling the bite of higher tariffs and consumer sentiments remain relatively muted. The US Energy Information Administration now projects 2025 full-year Chinese consumption at 16.53m BPD, down from its prediction of 16.74m BPD a year ago.

    If the tariffs successfully achieve Trump’s goal of reinvigorating American manufacturing, the dropoff in crude demand may be cushioned. However, it is far from guaranteed that discouraging overseas production is enough to bring a true boom back home. The US already has half a million unfilled manufacturing jobs according to the Labour Department, and half of employers in the sector say they face challenges in recruiting and retaining employees. April saw a second straight month of declining US manufacturing output while a PMI of 50.2 indicated only a marginal expansion. If tariffs fail to translate into meaningful gains in domestic manufacturing, they will effectively act as an economic speedbump for the world’s biggest oil consumer. In this case, crude demand will shrivel for both superpowers on either side of the Pacific.

    The Verdict

    For the foreseeable future, crude prices is likely to fall further.

    • Short-term global economic growth is likely to slow as a result of heightened tariffs, capping crude demand from the world’s two largest oil consumers: the US and China.
    • Non-OPEC production will grow significantly with greater extraction efficiencies and newly-established infrastructure in Canada, Brazil, Guyana and other countries.
    • Easing of geopolitical tensions brings the possibility of further excess supply, particularly from Iran.
    • Overall, the market faces imminent short-term crude oversupply.

    At the present, the oversupply threat is far from fully realized. As new production in the Americas come online and OPEC unwinds its voluntary cuts within the next 12-16 months, the extent of excess supply will be made more clear.

    It is likely that the current WTI front-month price range of $60 – $65/bbl will act as the new demand-dictated equilibrium for future adjustments. Once oversupply is realized in early-mid 2026, there is a significant chance it settles under the $60/bbl threshold. Barring a major reversal of trade policies, it is a probability – not a possibility – that crude remains in a bearish mode for the next 12-24 months with the potential to fall as low as $52 – $55/bbl.