Between 2020 – 2022, a market frenzy was sparked for clean hydrogen production as part of an overall green push that gave rise to billions of dollars worth of announced projects in tandem with the rollout of government incentives. Three years on, the enthusiasm has dwindled – and rightfully so, given the myriad of underlying infeasibilities that were masked by the initial craze.
Hydrogen Fundamentals
Hydrogen – from a consumption point of view – is a clean fuel because it produces zero carbon emissions when undergoing combustion or deployed in a fuel cell. However, its true carbon-neutrality depends on the method of production, which follows a colour-coded system. The most common origin of commercially produced hydrogen in the United States, by far, is steam-methane reforming (SMR). As its name suggests, the process reacts steam with methane – a common product in petroleum refineries – to produce hydrogen and carbon dioxide. This avenue of production is termed “grey” hydrogen and does not fall under the umbrella of “clean” hydrogen because of its carbon dioxide byproduct. Discussions of clean hydrogen usually refer to the “blue” and “green” variants. The former is produced via SMR just like its grey sibling, except the carbon dioxide byproduct is captured and sequestered in the process. The latter uses an entirely different mechanism called electrolysis in which water is split into its two constituent elements: oxygen and hydrogen. To conduct electrolysis, electricity must be supplied as an energy input, effectively generalizing green hydrogen production as a power-to-gas process using renewables such as solar and wind. Of the total North American hydrogen capacity online today, 96.1% is the grey type, while blue and green makes up 2.7% and 0.1% respectively.
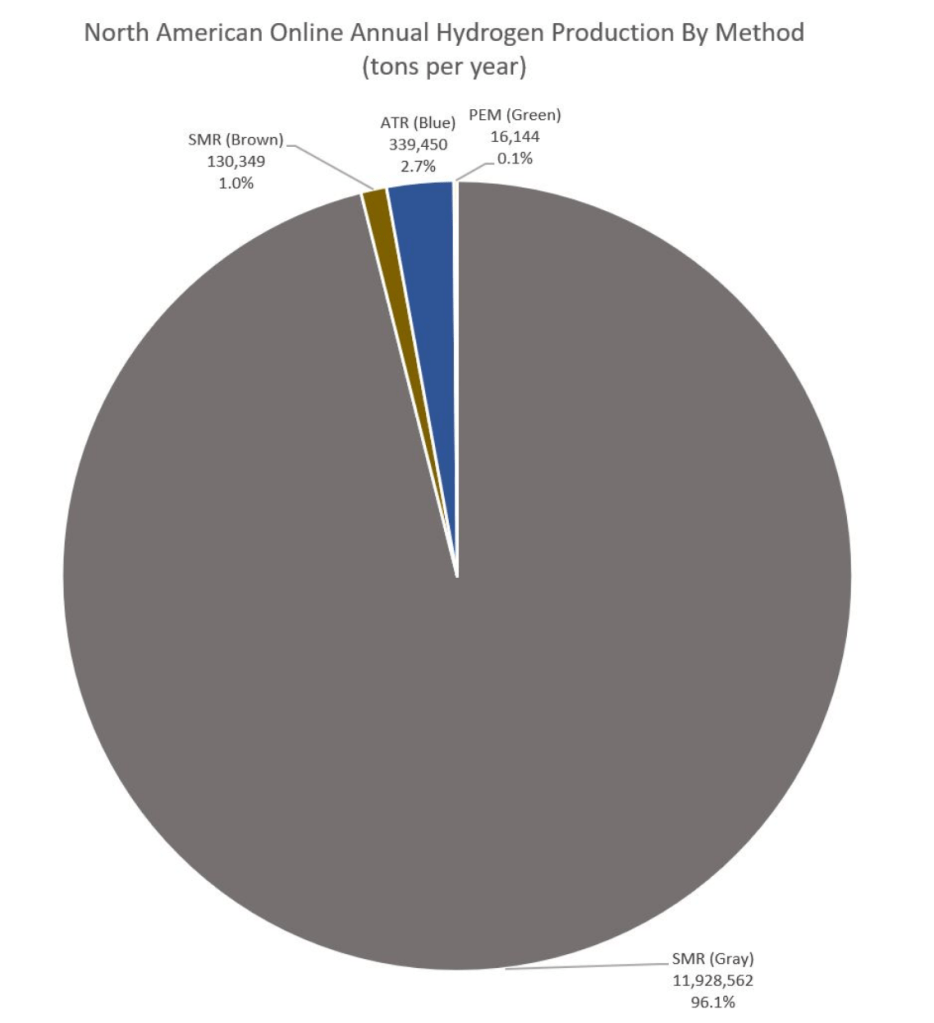
via “North American Hydrogen Production Report – January 2025” (respectmyplanet.org)
The Current Hydrogen Market
The hydrogen boom at the start of the decade triggered no shortage of chatter about boosting clean production, and yet there was little consideration for whether underlying demand existed for these planned production increases. While the marketing initiatives for these projects pushed a grand vision for hydrogen to be deployed in green applications such as zero-emission transportation, power generation, and heating, the reality of its usage is starkly different. Today, practically all hydrogen consumption in North America are for industrial uses – and virtually none for transportation or power generation. Perhaps ironically, the most prominent current application of hydrogen is for oil refining, where it is used in desulfurization and hydrocracking (converting heavier hydrocarbons into lighter, more valuable ones like gasoline and diesel). Another major point of consumption is for ammonia production, critical for fertilizer and various industrial chemical products. These two main usages, alongside numerous other chemical production processes, are the true drivers of hydrogen demand – not the imaginative green technologies heralded by environmentalist policy-pushers.
The industry-heavy nature of existing hydrogen demand introduces another niche industry characteristic: the supply doesn’t necessarily come from dedicated hydrogen merchants – in fact, merchant hydrogen accounts for just half of total US production. Most ammonia facilities make grey hydrogen on-site, while some oil refineries are fitted with their own SMR units. The result is a sizeable allocation of total hydrogen capacity to these in-house producers.
| Hydrogen Production Source | % of US Production |
| Oil refineries | 20 – 25% |
| Ammonia plants | 15% |
| Other chemical & industrial facilities | 15 – 20% |
| Merchant hydrogen | 40 – 50% |
The market for dedicated merchant gas is dominated by three major companies: Air Products, Linde, and Air Liquide.
In essence, there is nothing clean about North America’s current hydrogen usage or production. Attempts to force the industry into an environmental mold are not only misinformed, but destined to fail financially.
The Cost Gap
The rush of clean hydrogen endeavours during the boom was a case of gross demand overestimation. The most glaring attribute sealing its underwhelming fate is a simple one: cost.
| Hydrogen Type | Cost ($/kg) |
| Grey | $1.00 – $2.93 |
| Blue | $1.30 – $4.70 |
| Green | $3.00 – $7.00 |
Grey hydrogen – particularly for users with in-house SMR units – is simply so cost-efficient that it largely curbs any economic argument for pivoting to cleaner variants in the absence of government incentives. For select facilities already making grey hydrogen, blue production is somewhat plausible because the two mechanisms largely overlap bar the addition of a carbon-capture unit for the latter. The green kind, however, sticks out like a sore thumb. It is bogged down by expensive renewable power costs which is all the more apparent in the US than, say, China where solar and wind capacities are far more abundant. Furthermore, commercial electrolyzers – which typically operate around 70% efficiency – have high manufacturing, setup, and support costs. Another key consideration is the production location relative to its intended user. Hydrogen – first on periodic table of elements – packs incredibly low density which makes transportation significantly more difficult in comparison to other industrial gases. This poses a challenge for electrolysis facilities situated away from their would-be industrial customers, who must deal with additional costs – and energy losses – if they choose to switch from on-site grey / blue hydrogen to merchant green hydrogen. Due to these technical challenges, polarizing costs, and the maturity of existing SMR production dominating the market today, green hydrogen is unlikely to emerge as a commercially feasible option.
At a glance, blue and grey hydrogen’s cost differential seems far more acceptable, but the $0.30 – $1.77 gap would be wider if not for US government incentives – most notably the Inflation Reduction Act (IRA)’s $3/kg tax credit for clean production. Moreover, carbon captured and sequestered from SMR are eligible for up to $85/ton tax credits, though this is non-stackable with the aforementioned hydrogen benefits but nonetheless offers producers flexibility. At its core, blue and green production differ in that the former is a modification to matured technology while the latter is a completely new pathway. This raises questions regarding the long-run underlying appeal behind blue hydrogen: no matter how efficient the process becomes, it will simply never be cheaper than grey production. In other words, investments into blue hydrogen are driven purely by government environmental incentives, not in hopes of technological or efficiency improvements. However unlikely the prospect is, one can make the argument that there may be a future where electrolysis can produce gas that is both cheaper and cleaner, but this is an impossibility for its blue counterpart because it is merely an extension of SMR and can therefore never beat its “baseline” cost-efficiency. It would not be unreasonable, then, to term the blue hydrogen market dynamics as fully policy-driven.
Where’s the Demand?
Clean or not clean, the influx of planned hydrogen production needs matching demand growth to be justifiable. Unsurprisingly, projected supply far outpaces actual demand. As of last year, it was estimated that developmental projects in the US would bring 13.9m tons of extra annual production online by 2030. This paints a stark disparity when compared to the 10-11m tons that the country currently consumes per year. This gross demand overestimation failed in assuming imminent growth in hydrogen-based transportation and aviation, which were long shots at best. Although fuel-cell electric vehicles (FCEVs) are commercially available, its total count in the US stands at just 18,700 (less than 0.01% of the broader auto market) for passenger and commercial automotives combined, nearly all of which are located in California thanks to its status as the only state with usable refueling infrastructure. As of late, its growth outlook has been further hamstrung by the rise of standard battery electric vehicles, which boasts more than doubled energy efficiency. Hydrogen’s adoption in aviation remains largely in the space of small-craft regional test flights, and the broader effort suffered reality checks when Airbus – the main established player to show belief in the fuel – delayed its timelines and admitted commercial-sized applications won’t be viable within the next 20 years.
With these disruptive green innovations wiped out of the picture, the role of demand drivers falls back upon the unglamorous industrial companies who have long acted as the underappreciated backbone of the hydrogen market. Yet even they cannot accommodate the planned surge in supply. Barring a revolutionary technological shift in the oil & gas, fertilizer, or chemical industries, the gap between industrial hydrogen usage and future production is insurmountable.
Early Cracks
The reality of clean hydrogen production is already setting in for some investors. Air Products, one of the “big three” in the American merchant hydrogen market, began the year by axing multiple projects including a $500m green plant in New York as it fully exited the American green market as a whole. Last month, it paused construction for its blue facility in Louisiana while it attempts to sell off parts of the over-budget project.
The downwards spiral for green hydrogen is reflected in the broader market with only 7% of projects on schedule as of 2023 and the vast majority either paused or cancelled altogether. Blue initiatives have fared far better with minimal high-profile cancellations thus far, but their future is far from guaranteed. For starters, the Republican Party’s “One Big Beautiful Bill” seeks to eliminate the 45V clean hydrogen tax credit starting in 2026, putting a deep dent into the financial payoff for production efforts. Though this development is partially cushioned by the presence of 45Q carbon capture credits – which are due to remain in place even if the Republican tax-and-spending bill is passed – it nonetheless deals a blow to returns on the investments and operation of carbon capture in tandem with SMR units. In the context of blue hydrogen production, the $85/ton credit for captured & sequestered carbon is roughly equivalent to $0.80/kg of hydrogen produced when considering typical capture rates, which falls well below the potential $3.00/kg offered by 45V credits. This calls for careful consideration of economic viability in a scenario where hydrogen incentives are eliminated – a looming prospect in the current political climate.
Beneath the mathematics of incentive-driven returns, the foundation of demand is weak. Only 2% of new production planned for 2030 have binding offtake, while 6% have non-binding offtake and 92% have none at all. Even for projects that have reached final investment decisions, over 45% remain uncontracted. Combine this already-wobbly demand with potential slashes in government incentives and the outlook for clean hydrogen appears all the more muted. Adding to the uncertainty is global trade tensions which threaten to cast even more shadows over demand in the form of costlier foreign-made electrolyzers and reduced overseas demand for clean gas exports.
The Verdict
The euphoria around clean hydrogen production in the early 2020s ignored weak underlying demand and assumed explosive growth in sectors that lag well behind commercial viability. Fueling this misplaced enthusiasm was supply-side government incentives that encouraged irresponsible production boosts without stimulating reflective demand. The result is a market that is now plagued by uncontracted supply and the increasingly threatening prospect of diminished government benefits.
At its current pace, it is reasonable to forecast further collapses in planned clean hydrogen projects – even the blue type. Should the unravelling of environmental policy continue, the market will return to leaning on its established grey production base. For green hydrogen, it is a case of when – not if – investments will be abandoned. For blue hydrogen, its identity as an environmental-oriented modification of its grey sibling means that its future lies almost entirely on government policy.
The bottom line: near-term hydrogen demand is almost entirely industrial and is thus best accommodated using mature grey production infrastructure. The introduction of clean supply is unnecessary and grossly exaggerated, making it destined for failure in the absence of heavy government support.